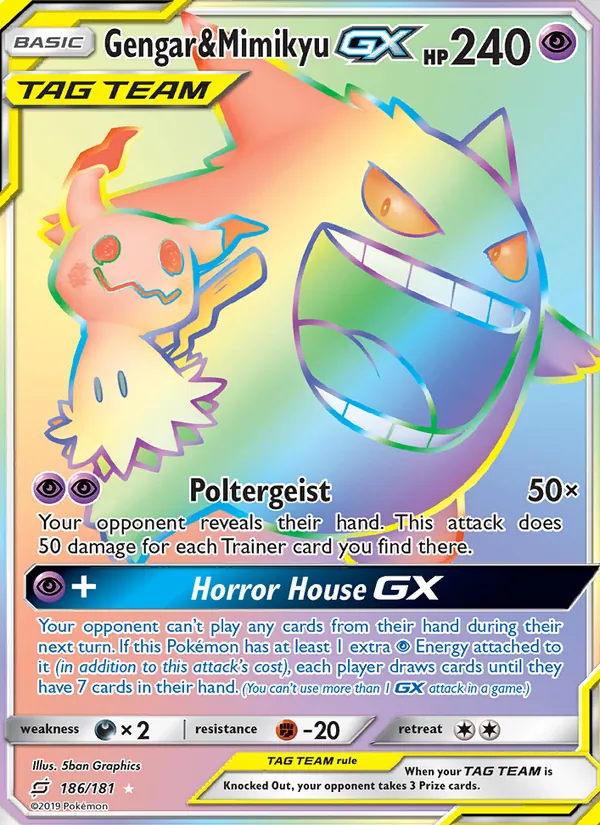
Gengar & Mimikyu GX
Team Up · Sun & Moon
- Number
- #186 / 181
- Supertype
- Pokemon
- HP
- 240
- Types
- Psychic
- Rarity
- Secret Rare
- Artist
- 5ban Graphics
Holofoil
Market Price
Last Sale
$406.53
as of ~Aug 2026
Lowest Ask
$332.37
Price History
Market Price↑ +10.4% (3M)
Market Signal
Price Trend
↑ +8.1% (30d trend)
high confidence90d Range
$368.39$406.53
0% below 90d high
Volatility
low0.3%
Signal uses price history only. Grading ROI, graded-market trend, and population scarcity activate when graded data is available.
◉ Buy · 1 of 4 factors available
Grading ROI Calculator
Enter your estimated sale price for each grade.
Sale price by grade (edit to override)
Grade 10
Grade 9
Grade 8
Grade 7
Grade 6
Grading company
Sell platform
| Grade | Sale Price | Grading Fee | Platform Fees | Net Profit | ROI% |
|---|---|---|---|---|---|
| 10 | $406.53 | $49.99 | $54.27 | $302.27 | 604.7% |
| 9 | $162.61 | $49.99 | $21.95 | $90.67 | 181.4% |
| 8breakeven | $81.31 | $49.99 | $11.17 | $20.15 | 40.3% |
| 7 | $48.78 | $49.99 | $6.86 | -$8.07 | -16.1% |
| 6 | $32.52 | $49.99 | $4.71 | -$22.18 | -44.4% |
Tax estimated at 28% max (long-term collectibles, IRC §1(h)(4)). Tax column hidden: enter a cost basis to see estimates. Platform fees generally reduce take-home but not your IRS capital gain.
Get detailed grade recommendation →Sign in to save this scenario to your portfolio.